| CHAPTER 3 Motion Scope | |||
Display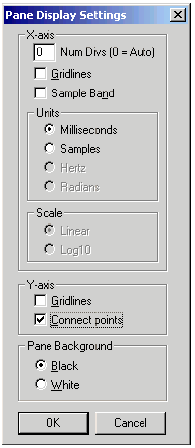
The Pane Display Settings panel sets the X- and Y-axis plotting characteristics for Motion Scope. Menu Items include: Y-axis / Connect points-- When enabled, traces are displayed with the Y-axis plotted as a continuous line between sample points. When disabled, Y-axis sample points are plotted as discrete points. 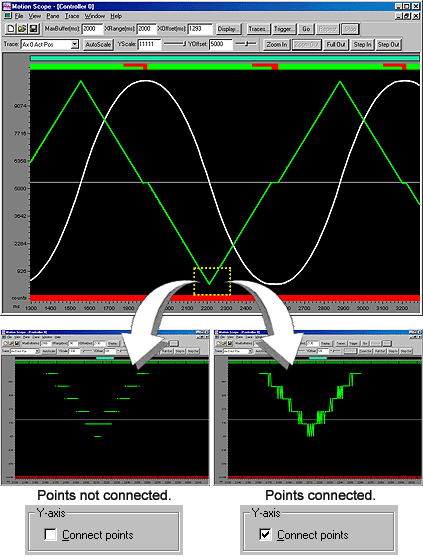
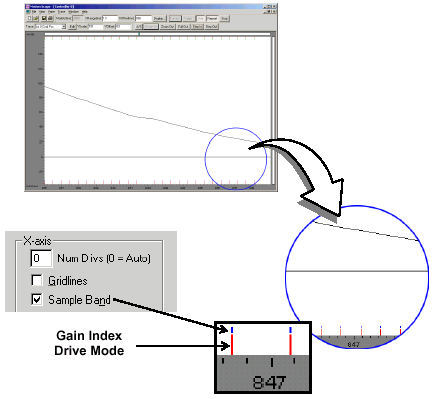
Sample
Band-- When enabled, a blue sample band is added to the bottom
of the plot which indicates individual samplings. Immediately below
the blue sample band, separate Gain Index and Custom Drive Mode
bands are visible when zoomed-in to higher magnification using the
Sample
numbers-- Changes the X-axis units from milliseconds (default)
to sample numbers.
| |||