| CHAPTER 3 Motion Scope | |||||||||||||||||||||||||||||||||
|
Motion Scope Quick-start Guide Quick-start DescriptionThis section will guide you through the most basic steps of using Motion Scope. It does not describe how to utilize advanced features, but it should prove helpful to new users. Three quick-start scenarios are presented below: Select a scenario (e.g., "B"), then follow the steps labeled with that letter below. 1. Launch Motion ScopeDouble click on the Motion Scope icon to launch the utility. A pane is displayed for XMP Controller 0: 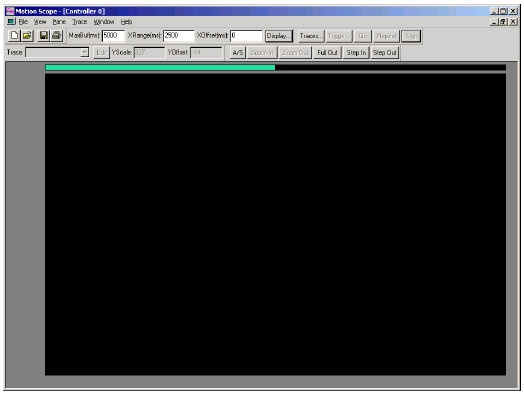
If
you wish to close this pane, click on the Close icon 2. Open and Configure a New PaneIf a pane is not already visible, the Motion Scope screen will appear blank, as shown here: 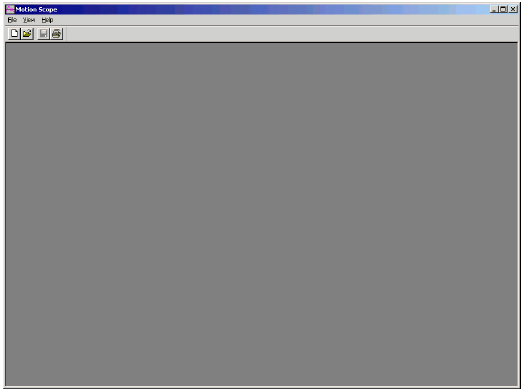
To open a new (or additional) pane, click on the File / New menu option. You will be presented with the Pane Mode panel: 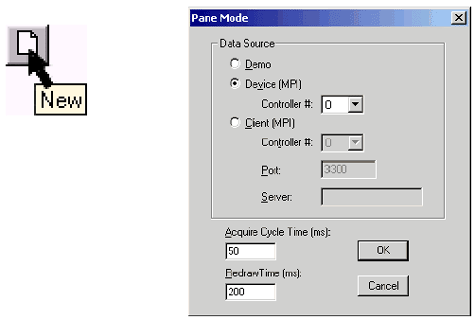
The Pane Mode panel identifies the source of signal data to be plotted. Depending upon your scenario, use the following list as a setting guide: 
If you wish to quickly demonstrate Motion Scope's features without connecting to real signal data, use the built-in Demo option. You should set your Pane Mode options as follows:

Motion Console can be used to generate simulated data, which is then viewed using Motion Scope. The simplest way to do this is to run Motion Console on the same platform where Motion Scope is installed. Set your Pane Mode options as follows:
NOTE: The Motion Console set-up for generating simulated feedback data is included below in Step #3. 
If you intend to use Motion Scope to view real motion control data, set your Pane Mode options as follows:
The Motion Console set-up for generating fake signal data is included below in Step #3. Click the OK button to enter settings into the Pane Mode panel and close. 3. Configure Trace SettingsAt this point, you have a blank pane with no traces. The next step is to tell Motion Scope which signal data to trace. This is done using the Pane / Traces menu item. To Quickly Demonstrate Motion Scope's Features
If
you have configured the new pane to run the built-in Demo
(from Step 2-A above), you have only four sources of
signal data available to you. All of them are "fake"
and exist only in your computer's memory. Now, let's look
at them. Click either on the Pane / Traces menu item, or use the Traces button at the top-middle of the display pane to access the Select Traces Set panel: 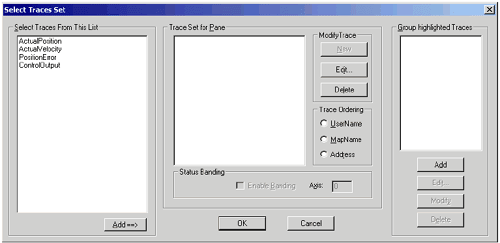
In the left column of the panel are listed the four sources of signal data available to you. They consist of: Remember, the displayed signals consist of "fake," archival data for demonstration purposes only. They do not correspond to anything real on your motion controller. To select demo data for tracing, click on the signal(s) to be plotted, then click on the Add==> button near the bottom-left corner of the panel. The selected signal(s) will be listed to the right, within the "Trace Set for Pane" window. If you make a mistake, or want to deselect a signal, highlight the signal with your mouse, then click on the Delete button on the right side of the pane. To Use Motion Scope Using Simulated Feedback Data
After you have configured the new pane to view simulated data from an XMP controller (from Step #2B above), Then you need to configure the XMP controller for step controller for step motor control with sinusoidal feedback:
Map
Motor 0 to Filter 0 and Filter 0 to Axis
0. Set the Motion Type field to either Trapezoidal or S-curve. On
the Motion Supervisor / Actions page, switch Repeat
Mode to Enable. Set the Type field to Stepper. Switch
the Step Loopback field to Enabled. Set
Velocity, Acceleration and Deceleration
to 100000. Your Motion Console panels should appear similar to those shown here: 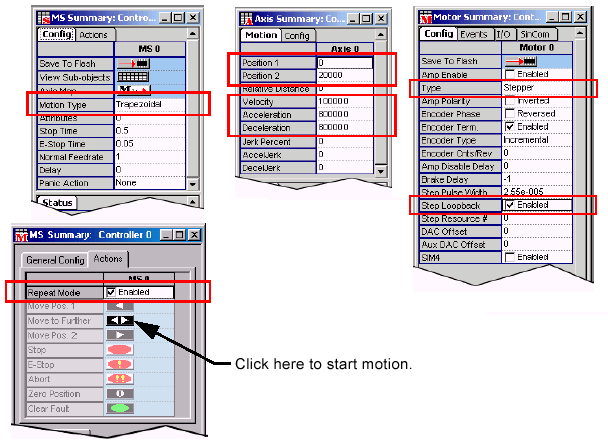

With the XMP controller generating the simulated data, you are now ready to use Motion Scope to view the data. Click either on the Pane / Traces menu item, or use the Traces button at the top-middle of the display pane to access the Select Traces Set panel: 
In
the left column of the panel are listed the signal data available
to you. Remember that for this example we have configured
Motion Console to utilize Axis 0; therefore only Ax 0
signals will produce interesting traces. All other non-configured
signals will generate flat, "dead" traces. To select data for tracing, click on the signal(s) to be plotted, then click on the Add==> button at the bottom of the panel. The selected signal(s) will be listed to the right, within the "Trace Set for Pane" window. If you make a mistake, or want to deselect a signal, highlight the signal with your mouse, then click on the Delete button on the right side of the pane.
To View Real Signal Data with Motion Scope
If
you have configured the new pane to view real motion controller
data (from Step #2C above), you may now proceed to setting
your hardware into motion and using Motion Scope to view controller
data. We will follow a procedure similar to Step #3B above,
except that you do not need Motion Console. The intent here
is to establish a simple, repeated motion with your hardware,
then trigger Motion Scope at the point of interest to you. If
Using Motion Console...
You are now ready to use Motion Scope to view the data. Click either on the Pane / Traces menu item, or use the Traces button at the top-middle of the display pane to access the Select Traces Set panel: 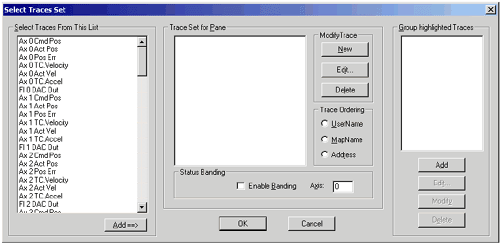
In
the left column of the panel are listed the signal data available
to you. Any signal data can be plotted, but only active signals
will produce interesting traces. All other non-configured
signals will generate flat, "dead" traces. To
select data for tracing, click on the signal(s) to be plotted,
then click on the Add==> button at the bottom of
the panel. The selected signal(s) will be listed to the right,
within the "Trace Set for Pane" window. If you make
a mistake, or want to deselect a signal, highlight the signal
with your mouse, then click on the Delete button on the right
side of the pane. 4. Configure Trigger The
next step consists of configuring the trigger to start Motion
Scope. Because Motion Scope has a limited memory buffer, it
cannot acquire and display data indefinitely. You must configure
it to acquire data during the time of particular interest to
you. Triggering operates the same, regardless of how you have configured your Trace panel, or whether you are working with real or fake data. 
Click either on the Pane / Trigger menu item, or use the Trigger button at the top-middle of the display pane to access the Trigger Conditions panel: 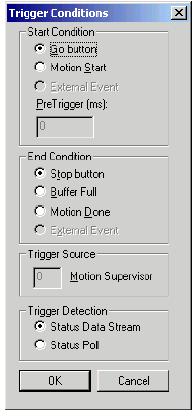
For quick-start purposes, we will trigger manually. Other forms of triggering are discussed in the "Trigger" reference section of this chapter below. To
manually trigger Motion Scope, select the Go button menu item. To
halt tracing manually, select the Stop button menu item. 5. Generate a Trace!The final step consists of making a trace with Motion Scope. At this point, you should have followed Steps #1-4 above to configure your pane, select the traces you want, and set up manual triggering. Signal data--either real or simulated--should now be available for plotting. 
To
trigger a plot, click on the Go button located at the
front of the display pane. You should see the data trace begin
on the left side, then sweep right and continue. Your pane may appear as shown here: 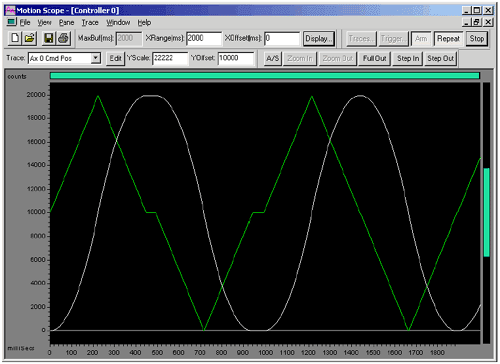
When
triggering manually, Motion Scope will continue tracing data
until the Stop button is clicked. In the "Motion Scope Feature Reference" section remaining in this chapter, you may learn more about Motion Scope's features, or contact MEI for assistance. | |||||||||||||||||||||||||||||||||
 Scenario
A: How to use the built-in Demo feature. No XMP controller
required.
 Scenario
B: How to use Motion Scope motion data from XMP controller
configured for stepper motors with simulated (step loopback) feedback.
 Scenario
C: How to use Motion Scope with Motion Console or application.
Motion data from XMP controller with real motion system.
 in the upper-right corner.
 You
should see the Command and Actual Position
fields on the Axis Summary panel count back and forth
between the Position 1 and 2 values (simulating
a back-and-forth motion). This will continue running until
you click on the MS Summary panel's Stop icon.