| CHAPTER 3 Motion Scope | |||
|
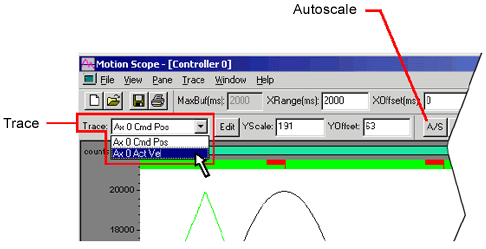
Trace-- The Trace field lists all currently plotted signal data using a pull-down menu. Y-axis scaling applies only to data currently selected from the Trace field.
AutoScale button-- Automatically scales the vertical, Y-axis of the display pane according to the range of data points plotted within the space afforded by the user-sized window. Selection of this menu item disables the YScale and YOffset fields (see "YScale and YOffset Fields" sections above). | |||